ค้นหาในสคริปต์สำหรับ "Buy sell"

ZenTrend Follower Signals (Backtest)Buy/Sell Entry signals based on the ZenTrend Follower indicator.
Entries are taken from the setup and trend breakout level, exits from the trailing stop loss.
Overextension and trend re-entry signals are ignored.
The indicator is linked below
If you enjoy these posts please like and subscribe so more people can join you :)
If you want to tryout the indicator and strategy, follow me and drop a comment or pm and I’ll get you set up.
Stay calm, and happy trading!
More information on the indicator can be found below:

Altcoins StrategyBuy/Sell Altcoins strategy. Based on moving averages, divergences, price and volume

Buy SellKıvanc hocanın yazdığı 2 stop loss indikatörünün birleşmesi sonucu bulundu. Çalışma mantığını kullandıkça anlayacaksınızıdır.


Buy Sell signal by Spicytrader
Get on board before going to the moon !
Spicytrader instantly identifies when a potential pump or dump is beginning.
Compatible with Autoview bot
GET ACCESS : spicytrader.com


Buy/Sell Using MACD and ReversalsUsing the crossover of Signal Line and MACD line predict the reversals of trends in the chart.


Buy/Sell Ahmed Rashiedtrade with confidence good for both intra day and long term took me 2 yrs to finish it

MULTIPLE TIME-FRAME STRATEGY(TREND, MOMENTUM, ENTRY) Hey everyone, this is one strategy that I have found profitable over time. It is a multiple time frame strategy that utilizes 3 time-frames. Highest time-frame is the trend, medium time-frame is the momentum and short time-frame is the entry point.
Long Term:
- If closed candle is above entry then we are looking for longs, otherwise we are looking for shorts
Medium Term:
- If Stoch SmoothK is above or below SmoothK and the momentum matches long term trend then we look for entries.
Short Term:
- If a moving average crossover(long)/crossunder(short) occurs then place a trade in the direction of the trend.
Close Trade:
- Trade is closed when the Medium term SmoothK Crosses under/above SmoothD.
You can mess with the settings to get the best Profit Factor / Percent Profit that matches your plan.
Best of luck!

[STRATEGY][RS]MicuRobert EMA cross V2Great thanks Ricardo , watch this man . Start at 2014 December with 1000 euro.


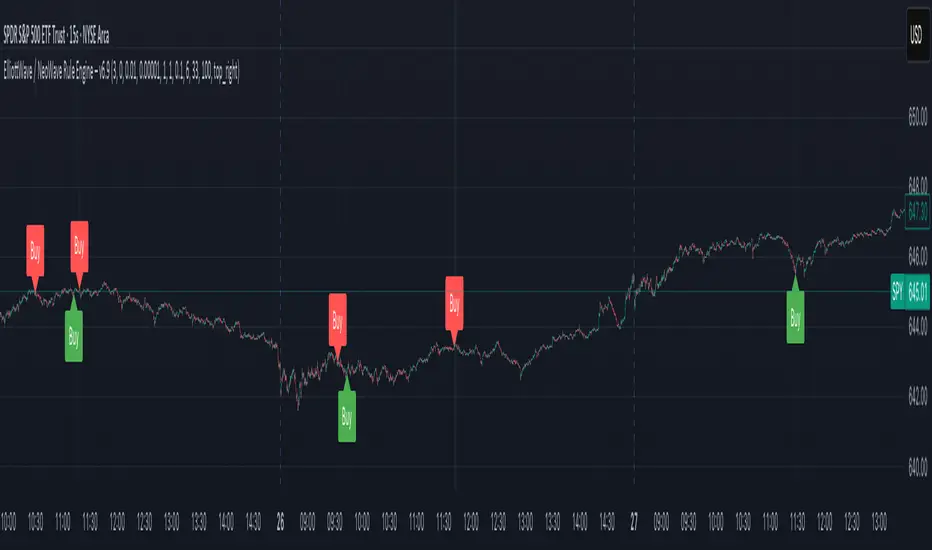
Elliott Wave / NeoWave Rule Engine – v6.9This script functions as a "rule engine" that automatically identifies significant price swings and then tests them against a comprehensive set of Elliott Wave rules and guidelines.
The goal is to filter out low-probability setups and identify valid motive (impulse and diagonal) waves by applying user-defined tolerances. The script plots swings on the chart and can display a real-time dashboard that shows which rules are passing or failing. When a valid motive wave is detected, it can generate buy or sell signals.
User Settings
The script's behavior is controlled by a set of user inputs, organized into four main groups.
Swing / ZigZag Detection
These settings control how the script identifies the price swings that form the basis of the wave patterns.
Pivot Left Bars & Pivot Right Bars: These two values determine the sensitivity of the swing detection. A pivot point (a high or low) is only identified if it is the highest or lowest price within the specified number of bars to its left and right. Increasing these numbers will result in fewer, larger swings.
Minimum swing % (filter micro noise): This is a crucial filter. It ignores swings that are too small to be considered significant, helping to clean up the chart and prevent the engine from analyzing "noise." For example, a value of 0.3 means any swing that is less than 0.3% of the price range will be ignored.
Rule Engine Tolerances
This group allows you to define how strict the validation rules are.
Fibonacci tolerance (±%): This sets the acceptable margin of error for Fibonacci relationships (e.g., a 0.618 retracement). A value of 0.001 means a retracement between 0.617 and 0.619 will be considered a valid match.
Same-degree TIME proportion max (x): This sets the maximum time difference allowed between waves of the same degree (e.g., Wave 1 and Wave 3) to still be considered "proportional." A value of 1 means Wave 3's duration can be up to 1 time longer than Wave 1's duration, and vice-versa.
Same-degree PRICE proportion max (x): Similar to the time tolerance, this sets the maximum price difference allowed between waves of the same degree to still be considered proportional.
Alternation slope ratio threshold: This is a key NeoWave guideline. It checks if Wave 2 and Wave 4 have different "sharpness" (price change per bar). A higher value makes the alternation rule stricter.
Min guideline passes for motive validation (0–7): This is the gating feature. Even if a pattern passes all the hard Elliott Wave rules (e.g., no overlap, Wave 3 isn't the shortest), you can still require it to pass a minimum number of guidelines (like Fibonacci relationships, alternation, etc.) before a signal is generated. A value of 7 means every guideline must be met.
Momentum / Volume Guidelines
These are additional checks for pattern validation.
Momentum length: This setting controls a proxy for momentum, which is calculated based on the speed of price movement.
Use volume checks: This is a placeholder for future functionality. It does not currently affect the script's behavior.
UI / Debug
These settings control the visual aspects of the script on your chart.
Max swings to keep/evaluate: This determines how far back the script looks to find and analyze swings. A larger number will analyze more historical patterns but may impact performance.
Show detected labels: Toggles the display of numerical (1-2-3-4-5) and letter (A-B-C) labels on the detected waves.
Show rule PASS/FAIL dashboard: Toggles the on-chart table that provides a detailed breakdown of which rules and guidelines are met.
Table Position: Controls where the rule dashboard is located on your chart.
Print debug info to Data Window: If you are a developer or want to see the underlying data, this will print information to TradingView's Data Window.
Show Buy/Sell Signals: Toggles the display of Buy/Sell signals. These signals are only generated when a pattern passes all the hard rules and your minimum guideline pass requirement.
features complete buy and sell code Below is a single TradingView (Pine Script v5) indicator that fuses the key futures intraday ingredients you asked for — VWAP, EMAs, MACD, volume spike, synthetic order-flow (CVD), prior day levels, ATR proximity, and Fib-pullback logic from recent swings — into a buy/sell timing score with signals and alerts.
It’s designed for ES/MES/NQ/CL/GC etc., but works on any intraday chart. Footprint/true bid-ask delta isn’t available in Pine, so I implement a synthetic delta/CVD (industry standard approximation) that’s reliable enough for timing confirmation.
Bias: price vs VWAP & 200 EMA; above = bullish bias; below = bearish.
Momentum: 8/21 EMA alignment and MACD histogram.
Order flow (synthetic): bar delta & CVD slope.
Volume: spike vs SMA.
Levels: previous day High/Low/Close + ATR proximity.
Fibonacci: uses pivots to auto-anchor last impulse and watch for 50–61.8% pullbacks with confirmation.
Score: sums weighted conditions → fires BUY/SELL when threshold is met.
Alerts: ready to use (Create Alert… on this indicator).
